![]() See this visualization first on the Voronoi app.
See this visualization first on the Voronoi app.
A Map of Global Happiness By Country in 2024
This was originally posted on our Voronoi app. Download the app for free on iOS or Android and discover incredible data-driven charts from a variety of trusted sources.
Happiness, like love, is perhaps one of the least understood and most sought-after emotions and experiences in human life.
And while many inspiring teachings exist about attaining individual happiness, it’s worthwhile to consider how happy entire countries are on a collective scale.
Happiness is when what you think, what you say, and what you do are in harmony. — Mahatma Gandhi
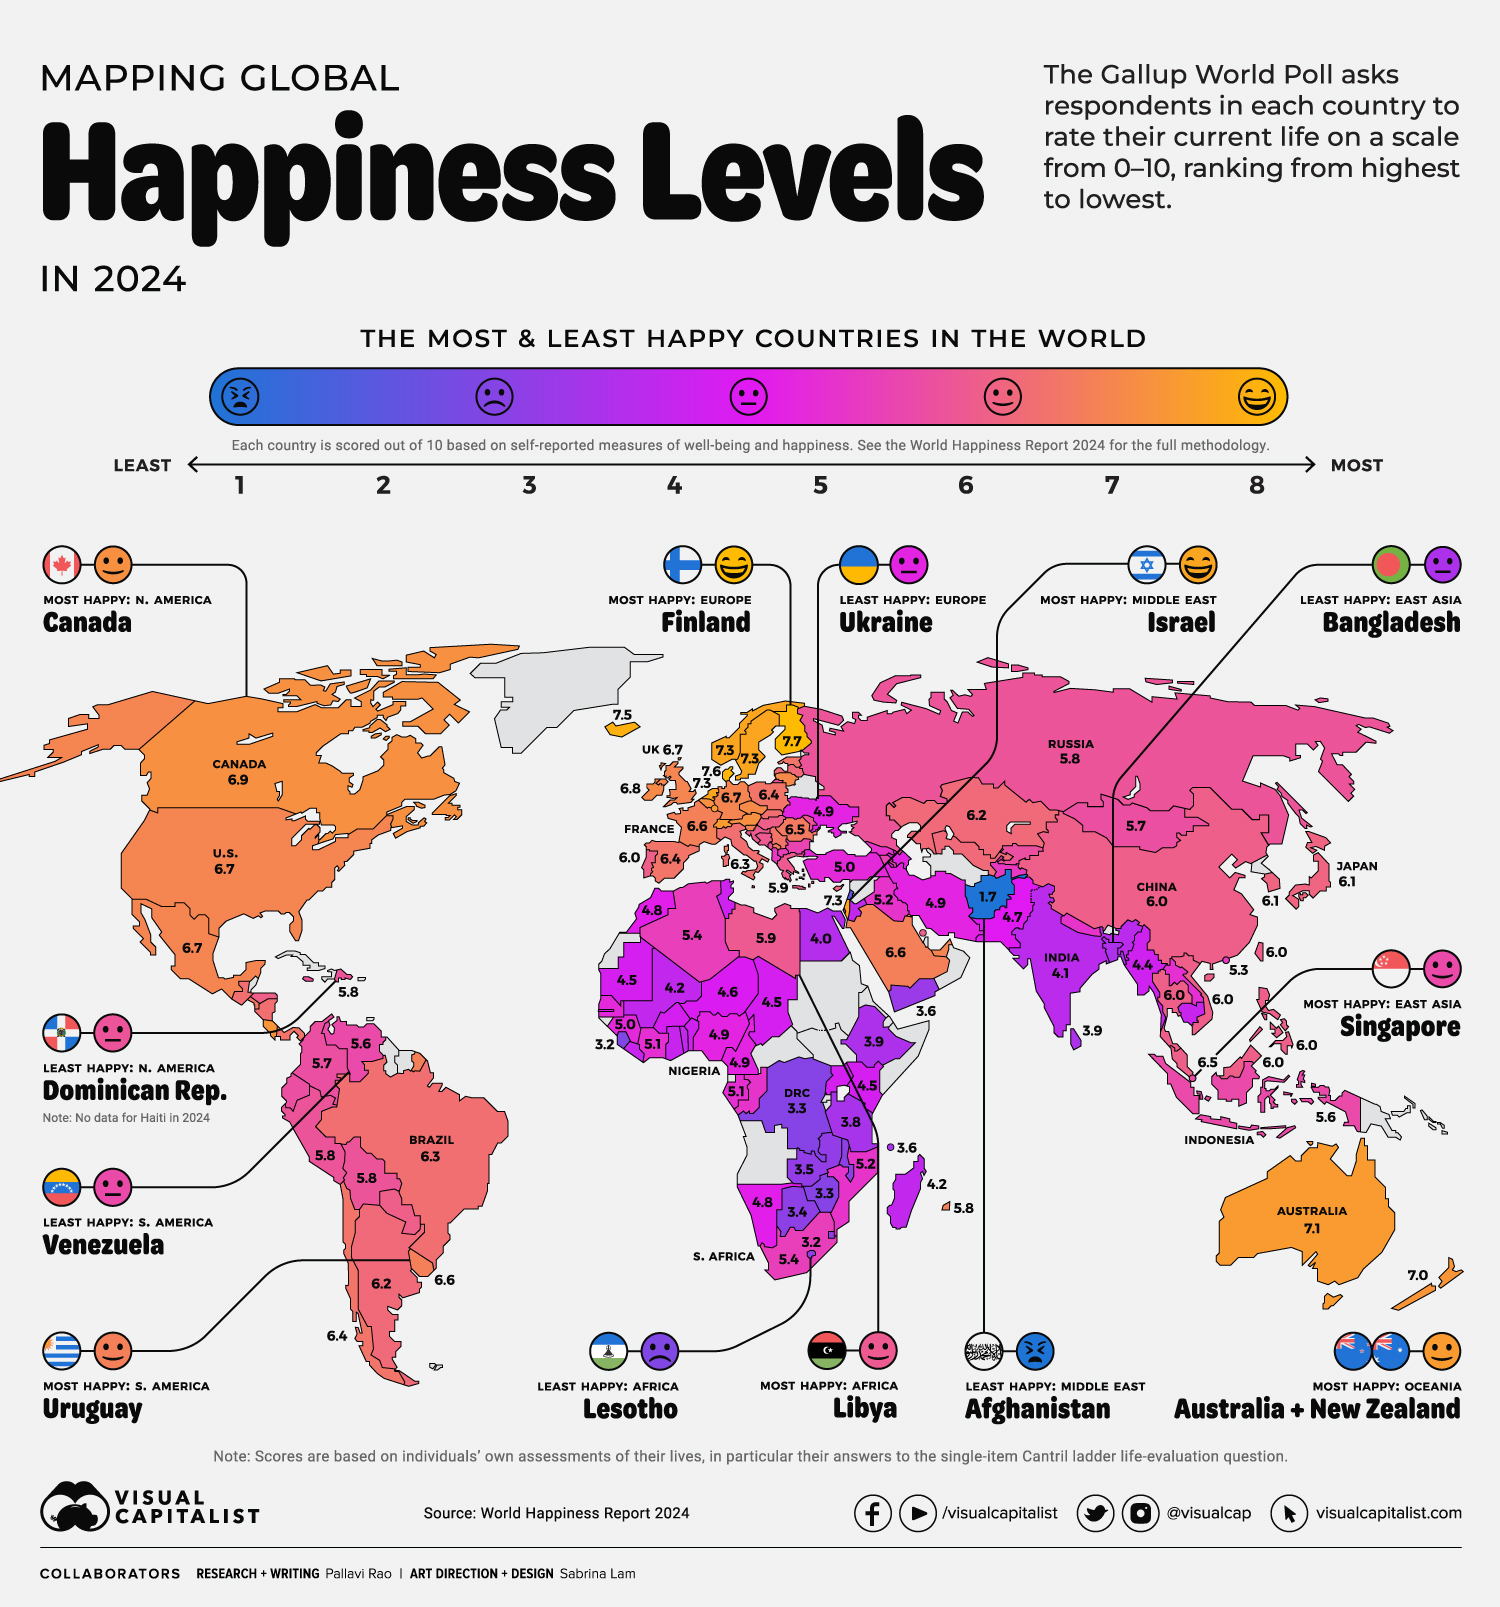
We visualize the findings from the World Happiness Report 2024, an enduring attempt to measure, quantify, and compare happiness levels around the world, sourcing data from Gallup.
The Gallup World Poll surveys approximately 1,000 respondents in nearly every country on a variety of issues, one of which is to evaluate their current life on a scale from 0–10.
The World Happiness Report then averages the score from life evaluations per country over a three-year period (2021–2023 for this year’s edition) and ranks from highest to lowest. For a full breakdown of how this works, please see the end of this article.
 The effects of cataclysmic events during a particular year can be muted, depending on both the three-year averaging and when the survey took place in the country.
Ranked: The Most & Least Happy Countries in 2024
The top 10 happiest countries—led by Finland, Denmark, and Iceland—have remained largely unchanged since 2023’s findings.
| Rank | Country | Region | Average Happiness Score (2021–2023) |
|---|---|---|---|
| 1 |  Finland Finland | Europe | 7.7 |
| 2 |  Denmark Denmark | Europe | 7.6 |
| 3 |  Iceland Iceland | Europe | 7.5 |
| 4 |  Sweden Sweden | Europe | 7.3 |
| 5 |  Israel Israel | Middle East | 7.3 |
| 6 |  Netherlands Netherlands | Europe | 7.3 |
| 7 |  Norway Norway | Europe | 7.3 |
| 8 |  Luxembourg Luxembourg | Europe | 7.1 |
| 9 |  Switzerland Switzerland | Europe | 7.1 |
| 10 |  Australia Australia | Oceania | 7.1 |
| 11 |  New Zealand New Zealand | Oceania | 7.0 |
| 12 |  Costa Rica Costa Rica | Central America | 7.0 |
| 13 |  Kuwait Kuwait | Middle East | 7.0 |
| 14 |  Austria Austria | Europe | 6.9 |
| 15 |  Canada Canada | North America | 6.9 |
| 16 |  Belgium Belgium | Europe | 6.9 |
| 17 |  Ireland Ireland | Europe | 6.8 |
| 18 |  Czechia Czechia | Europe | 6.8 |
| 19 |  Lithuania Lithuania | Europe | 6.8 |
| 20 |  UK UK | Europe | 6.7 |
| 21 |  Slovenia Slovenia | Europe | 6.7 |
| 22 |  UAE UAE | Middle East | 6.7 |
| 23 |  U.S. U.S. | North America | 6.7 |
| 24 |  Germany Germany | Europe | 6.7 |
| 25 |  Mexico Mexico | North America | 6.7 |
| 26 |  Uruguay Uruguay | South America | 6.6 |
| 27 |  France France | Europe | 6.6 |
| 28 |  Saudi Arabia Saudi Arabia | Middle East | 6.6 |
| 29 |  Kosovo Kosovo | Europe | 6.6 |
| 30 |  Singapore Singapore | Asia | 6.5 |
| 31 |  Taiwan Taiwan | Asia | 6.5 |
| 32 |  Romania Romania | Europe | 6.5 |
| 33 |  El Salvador El Salvador | Central America | 6.5 |
| 34 |  Estonia Estonia | Europe | 6.4 |
| 35 |  Poland Poland | Europe | 6.4 |
| 36 |  Spain Spain | Europe | 6.4 |
| 37 |  Serbia Serbia | Europe | 6.4 |
| 38 |  Chile Chile | South America | 6.4 |
| 39 |  Panama Panama | Central America | 6.4 |
| 40 |  Malta Malta | Europe | 6.3 |
| 41 |  Italy Italy | Europe | 6.3 |
| 42 |  Guatemala Guatemala | Central America | 6.3 |
| 43 |  Nicaragua Nicaragua | Central America | 6.3 |
| 44 |  Brazil Brazil | South America | 6.3 |
| 45 |  Slovakia Slovakia | Europe | 6.3 |
| 46 |  Latvia Latvia | Europe | 6.2 |
| 47 |  Uzbekistan Uzbekistan | Asia | 6.2 |
| 48 |  Argentina Argentina | South America | 6.2 |
| 49 |  Kazakhstan Kazakhstan | Asia | 6.2 |
| 50 |  Cyprus Cyprus | Europe | 6.1 |
| 51 |  Japan Japan | Asia | 6.1 |
| 52 |  South Korea South Korea | Asia | 6.1 |
| 53 |  Philippines Philippines | Asia | 6.0 |
| 54 |  Vietnam Vietnam | Asia | 6.0 |
| 55 |  Portugal Portugal | Europe | 6.0 |
| 56 |  Hungary Hungary | Europe | 6.0 |
| 57 |  Paraguay Paraguay | South America | 6.0 |
| 58 |  Thailand Thailand | Asia | 6.0 |
| 59 |  Malaysia Malaysia | Asia | 6.0 |
| 60 |  China China | Asia | 6.0 |
| 61 |  Honduras Honduras | Central America | 6.0 |
| 62 |  Bahrain Bahrain | Middle East | 6.0 |
| 63 |  Croatia Croatia | Europe | 5.9 |
| 64 |  Greece Greece | Europe | 5.9 |
| 65 |  Bosnia & Bosnia &Herzegovina | Europe | 5.9 |
| 66 |  Libya Libya | Africa | 5.9 |
| 67 |  Jamaica Jamaica | North America | 5.8 |
| 68 |  Peru Peru | South America | 5.8 |
| 69 |  Dominican Republic Dominican Republic | Central America | 5.8 |
| 70 |  Mauritius Mauritius | Africa | 5.8 |
| 71 |  Moldova Moldova | Europe | 5.8 |
| 72 |  Russia Russia | Europe | 5.8 |
| 73 |  Bolivia Bolivia | South America | 5.8 |
| 74 |  Ecuador Ecuador | South America | 5.7 |
| 75 |  Kyrgyzstan Kyrgyzstan | Asia | 5.7 |
| 76 |  Montenegro Montenegro | Europe | 5.7 |
| 77 |  Mongolia Mongolia | Asia | 5.7 |
| 78 |  Colombia Colombia | South America | 5.7 |
| 79 |  Venezuela Venezuela | South America | 5.6 |
| 80 |  Indonesia Indonesia | Asia | 5.6 |
| 81 |  Bulgaria Bulgaria | Europe | 5.5 |
| 82 |  Armenia Armenia | Asia | 5.5 |
| 83 |  South Africa South Africa | Africa | 5.4 |
| 84 |  North Macedonia North Macedonia | Europe | 5.4 |
| 85 |  Algeria Algeria | Africa | 5.4 |
| 86 |  Hong Kong Hong Kong | Asia | 5.3 |
| 87 |  Albania Albania | Europe | 5.3 |
| 88 |  Tajikistan Tajikistan | Asia | 5.3 |
| 89 |  Congo Congo | Africa | 5.2 |
| 90 |  Mozambique Mozambique | Africa | 5.2 |
| 91 |  Georgia Georgia | Europe | 5.2 |
| 92 |  Iraq Iraq | Middle East | 5.2 |
| 93 |  Nepal Nepal | Asia | 5.2 |
| 94 |  Laos Laos | Asia | 5.1 |
| 95 |  Gabon Gabon | Africa | 5.1 |
| 96 |  Ivory Coast Ivory Coast | Africa | 5.1 |
| 97 |  Guinea Guinea | Africa | 5.0 |
| 98 |  Turkey Turkey | Asia | 5.0 |
| 99 |  Senegal Senegal | Africa | 5.0 |
| 100 |  Iran Iran | Middle East | 4.9 |
| 101 |  Azerbaijan Azerbaijan | Asia | 4.9 |
| 102 |  Nigeria Nigeria | Africa | 4.9 |
| 103 |  Palestine Palestine | Middle East | 4.9 |
| 104 |  Cameroon Cameroon | Africa | 4.9 |
| 105 |  Ukraine Ukraine | Europe | 4.9 |
| 106 |  Namibia Namibia | Africa | 4.8 |
| 107 |  Morocco Morocco | Africa | 4.8 |
| 108 |  Pakistan Pakistan | Asia | 4.7 |
| 109 |  Niger Niger | Africa | 4.6 |
| 110 |  Burkina Faso Burkina Faso | Africa | 4.5 |
| 111 |  Mauritania Mauritania | Africa | 4.5 |
| 112 |  Gambia Gambia | Africa | 4.5 |
| 113 |  Chad Chad | Africa | 4.5 |
| 114 |  Kenya Kenya | Africa | 4.5 |
| 115 |  Tunisia Tunisia | Africa | 4.4 |
| 116 |  Benin Benin | Africa | 4.4 |
| 117 |  Uganda Uganda | Africa | 4.4 |
| 118 |  Myanmar Myanmar | Asia | 4.4 |
| 119 |  Cambodia Cambodia | Asia | 4.3 |
| 120 |  Ghana Ghana | Africa | 4.3 |
| 121 |  Liberia Liberia | Africa | 4.3 |
| 122 |  Mali Mali | Africa | 4.2 |
| 123 |  Madagascar Madagascar | Africa | 4.2 |
| 124 |  Togo Togo | Africa | 4.2 |
| 125 |  Jordan Jordan | Middle East | 4.2 |
| 126 |  India India | Asia | 4.1 |
| 127 |  Egypt Egypt | Africa | 4.0 |
| 128 |  Sri Lanka Sri Lanka | Asia | 3.9 |
| 129 |  Bangladesh Bangladesh | Asia | 3.9 |
| 130 |  Ethiopia Ethiopia | Africa | 3.9 |
| 131 |  Tanzania Tanzania | Africa | 3.8 |
| 132 |  Comoros Comoros | Africa | 3.6 |
| 133 |  Yemen Yemen | Middle East | 3.6 |
| 134 |  Zambia Zambia | Africa | 3.5 |
| 135 |  Eswatini Eswatini | Africa | 3.5 |
| 136 |  Malawi Malawi | Africa | 3.4 |
| 137 |  Botswana Botswana | Africa | 3.4 |
| 138 |  Zimbabwe Zimbabwe | Africa | 3.3 |
| 139 |  DRC DRC | Africa | 3.3 |
| 140 |  Sierra Leone Sierra Leone | Africa | 3.2 |
| 141 |  Lesotho Lesotho | Africa | 3.2 |
| 142 |  Lebanon Lebanon | Middle East | 2.7 |
| 143 |  Afghanistan Afghanistan | Asia | 1.7 |
However the top 20 has some new entrants—Costa Rica and Kuwait—matched by the departures of the U.S. and Germany from the same ranks.
A correlation between population size and happiness can be seen clearly when looking at the first 20 spots on the happiness rankings.
In the top 10 only the Netherlands and Australia have populations over 15 million. In the top 20, only Canada and the UK have populations over 30 million.
Afghanistan, ranked last, has the lowest happiness on the scale (1.7) and is the only Asian country in the bottom 10, which is mostly populated by nations in Africa.
We explore some regional highlights as well:
Happiness Levels in North & South America and Europe
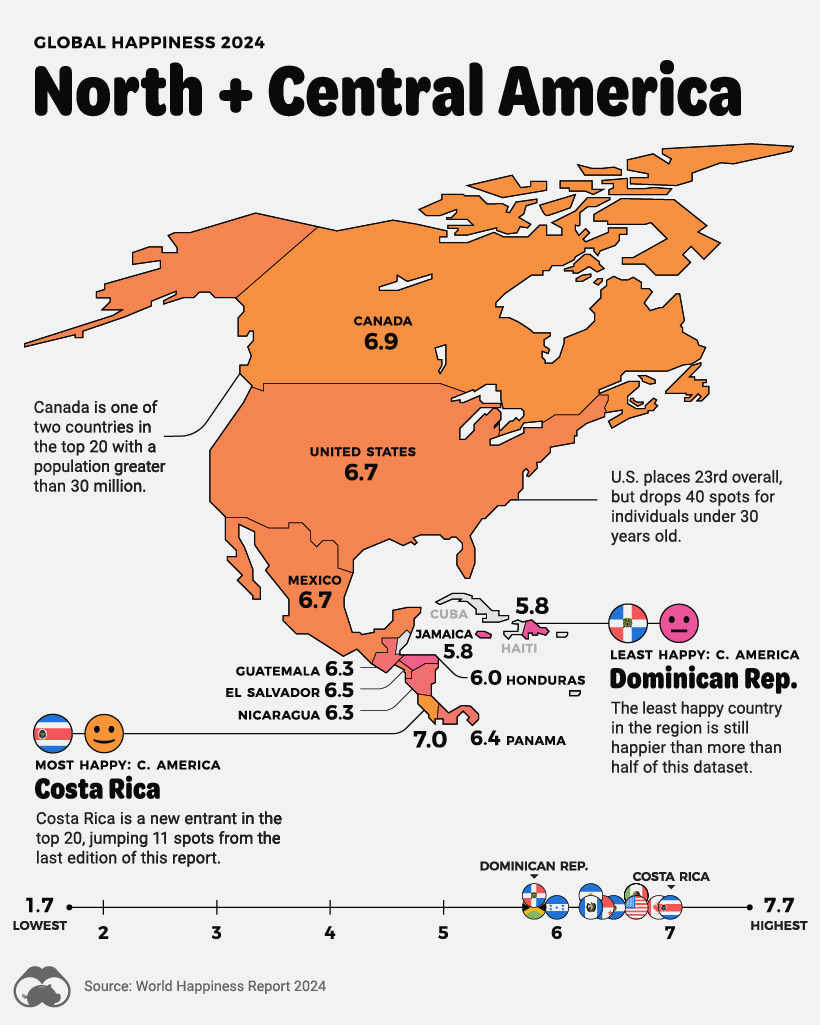
Previously mentioned Costa Rica, ranked 12th, is North and Central America’s happiest country, beating Canada by a 0.1 score, or three ranks.
The report highlights an interesting phenomenon for the two most developed economies in the region, the U.S., (23rd) and Canada (15th), where the old are significantly more happy than the young, a pattern seen in Nordic Europe as well.
The Dominican Republic continues to be the least happy country in the region, but it’s worthwhile noting it’s still happier than more than half of the other nations in the dataset.
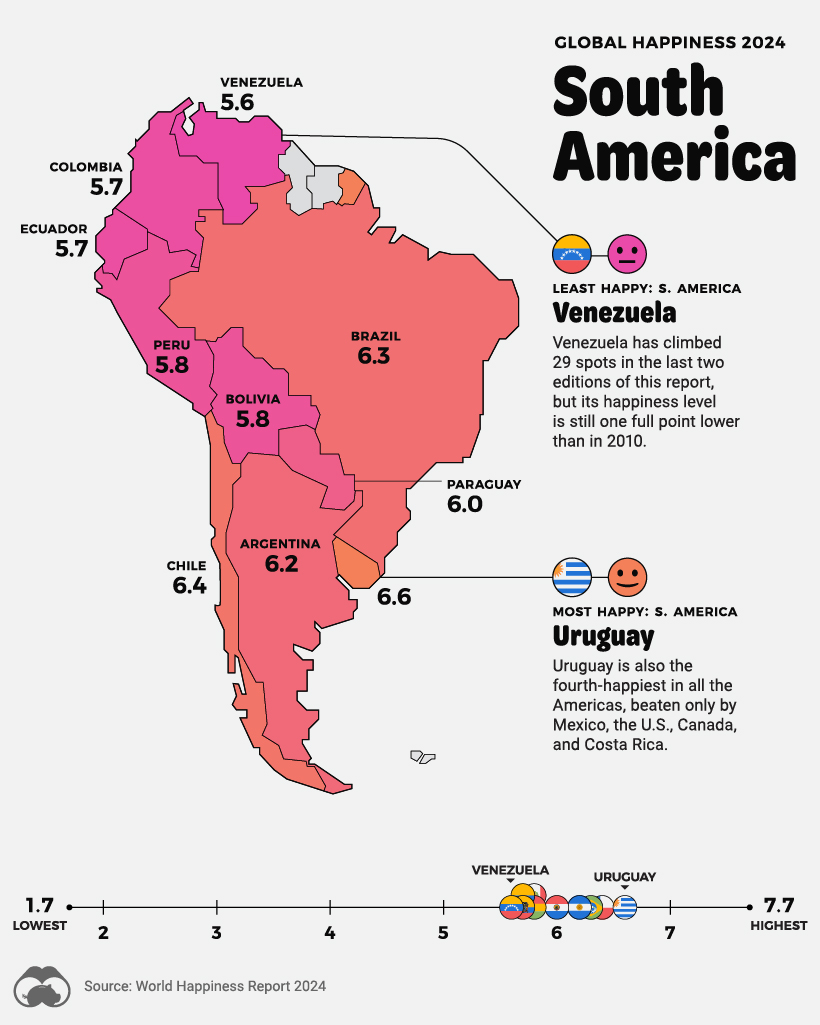
Uruguay, ranked 26th, once again leads South America’s happiest countries, and is in the fifth-happiest in the entire Americas, beaten only by Mexico, the U.S., Canada, and Costa Rica.
And, once again, Venezuela, ranked 79th, is South America’s unhappiest country, despite climbing more than 29 spots in the last two editions of this report.
While recent trends are encouraging, the Venezuelan populace is still significantly unhappier than in 2010, a full point lower on the scale, and the fourth-worst fall in the dataset.
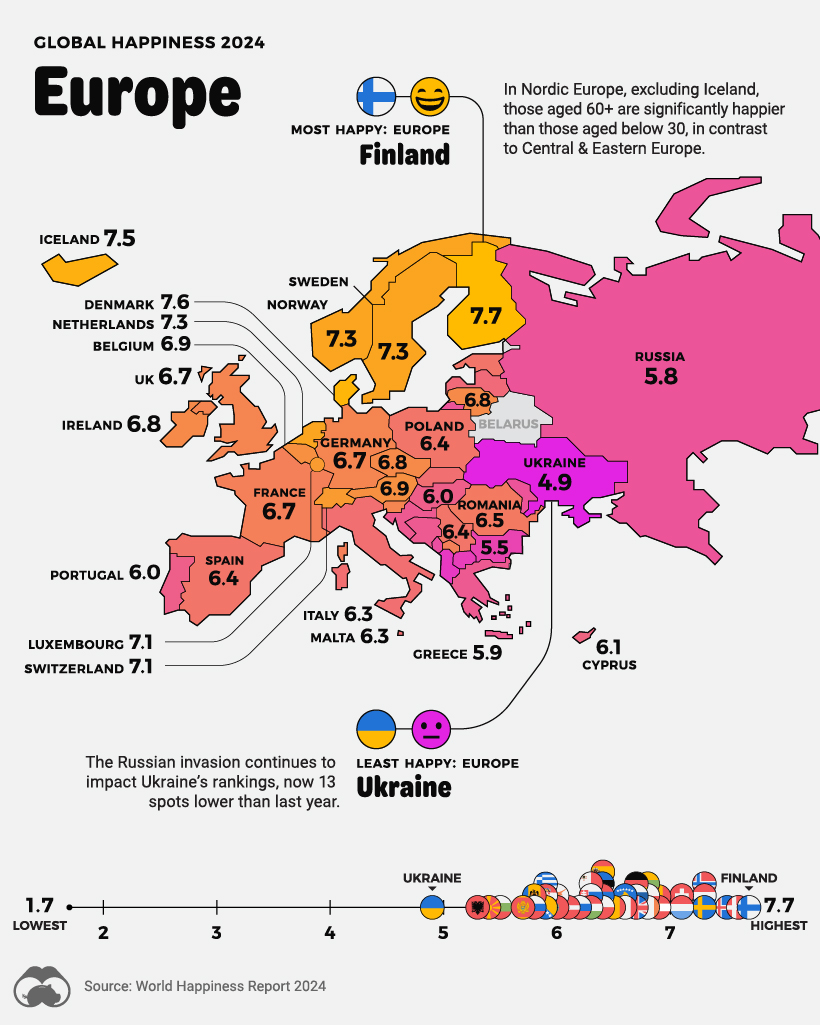
Aside from the top happiness ranks populated by small, wealthy European nations, the report also notes that the continent is seeing a convergence in happiness levels between Central & Eastern Europe and Western Europe—when in previous decades Western Europe was significantly happier.
In fact those under the age of 30 are equally happy across the continent, with only the older age groups seeing a gap.
Ukraine, now with two full years of battling the Russian invasion, is the unhappiest country in Europe, ranked 105th overall.
Happiness Levels in Asia, the Middle East, Oceania and Africa
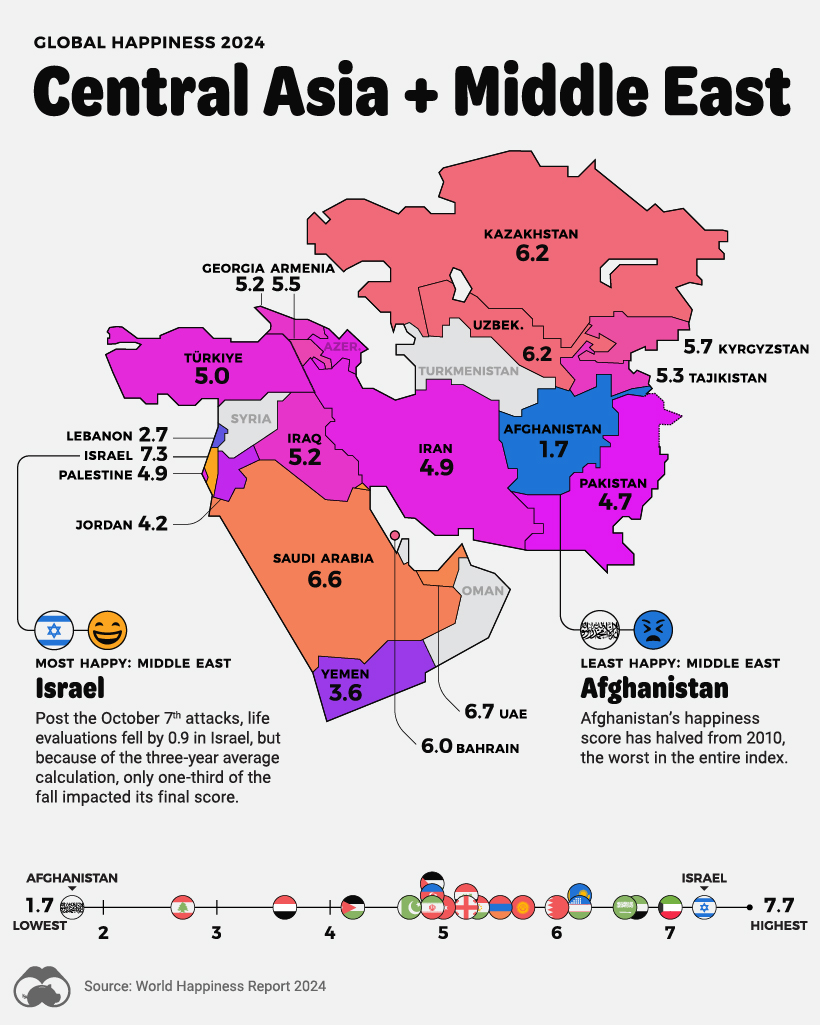
In the Middle East and Central Asia, Israel, at fifth place, leads the region’s happiness levels, dropping one spot since 2023.
The report notes that Gallup’s survey in Israel occurred after October 7th, but before much of the subsequent warfare. Thus, life evaluations fell by 0.9 for the year, of which only one-third impacted their final score.
However, the survey in Palestine (ranked 103rd globally) took place earlier in the year, before October 7th.
In Central Asia, Afghanistan’s happiness is not only the lowest measured in the world, its score has also halved since 2010, the worst of all countries in the same time period.
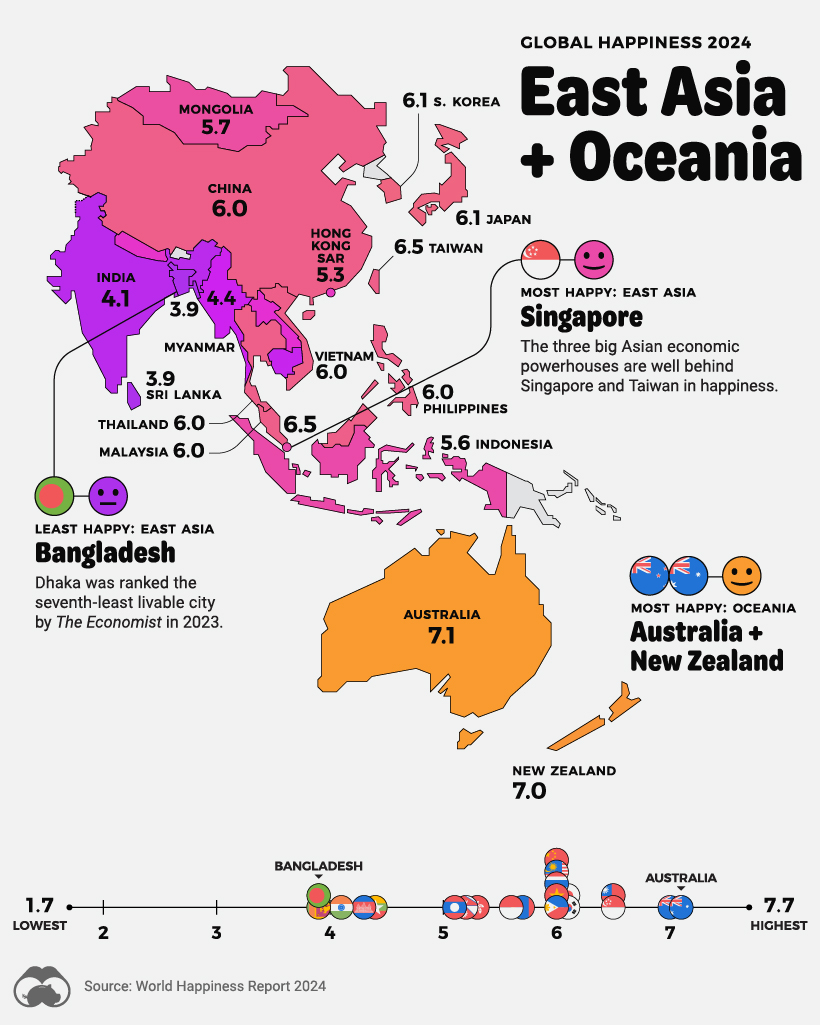
Meanwhile, in South and East Asia, Singapore (30th) and Taiwan (31st), are well ahead of regional economic heavyweights, China (60th), Japan (51st), and India (126th), when it comes to happiness levels.
In Oceania, Australia (10th) and New Zealand (11th), happiness dispersion mirrors the U.S., Canada, and the Nordics, in that the old are much happier than the young.
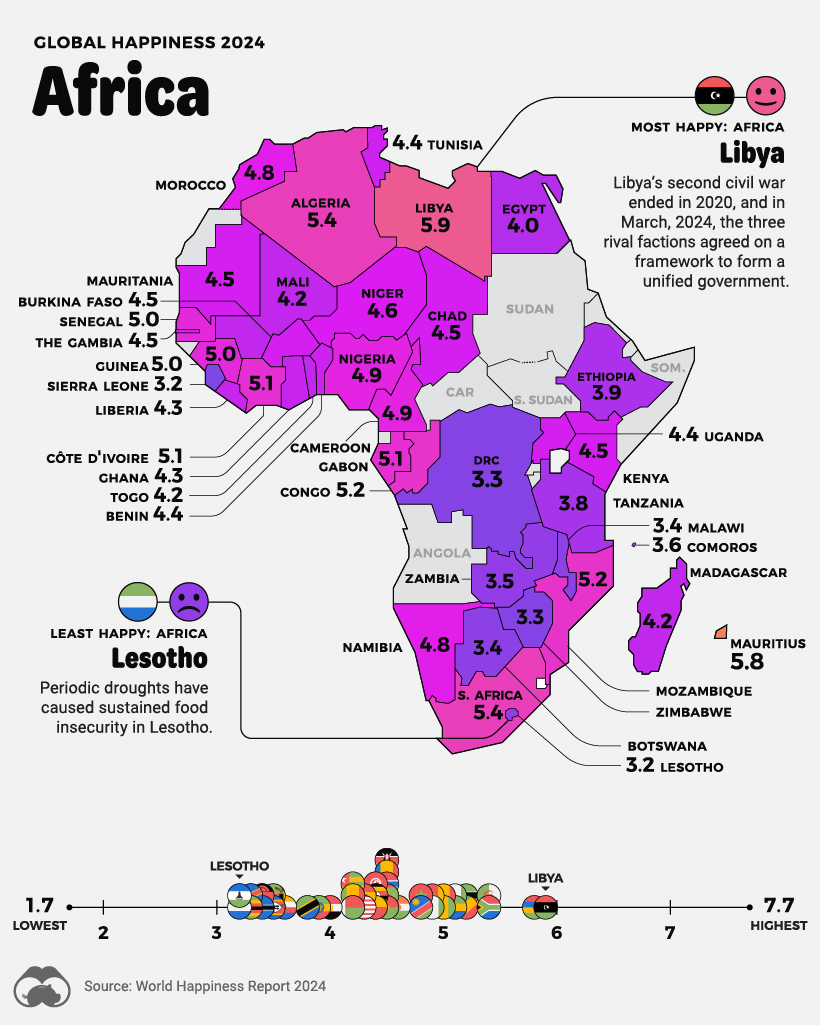
The world’s second largest continent, Africa, accounts for nine of the bottom 10 least happiest countries in the world, many of them clustered around Africa’s Great Lakes.
Lesotho is the unhappiest country in Africa and third-worst overall. The country’s residents often immigrate to neighboring South Africa, both in search of opportunities as well as escaping persistent food insecurity from recurring droughts.
On the other hand, Africa’s happiest country, Libya has seen a resurgence in political stability recently. The country’s second civil war ended in 2020, and recently the three main ruling factions have agreed on a framework for a unified government.
Where does this data come from?
Source: The World Happiness Report which leverages data from the Gallup World Poll.
Methodology: A nationally representative group of approximately 1,000 people is asked a series of questions relating to their life satisfaction, as well as positive and negative emotions they are experiencing. The life evaluation question is based on the Cantril ladder, wherein the top of the ladder represents the best possible life for a person (a score of 10/10) and on the flipside, the worst possible life (scored as 0/10). The main takeaway is that the scores result from self-reported answers by citizens of each of these countries. The results received a confidence interval of 95%, meaning that there is a 95% chance that the answers and population surveyed represent the average. As well, scores are averaged over the past three years in order to increase the sample size of respondents in each country.
Criticisms: Critics of the World Happiness Report point out that survey questions measure satisfaction with socioeconomic conditions as opposed to individual emotional happiness. As well, there are myriad cultural differences around the world that influence how people think about happiness and life satisfaction. Finally, there can be big differences in life satisfaction between groups within a country, which are averaged out even in a nationally representative group. The report does acknowledge inequality as a factor by measuring the “gap” between the most and least happy halves of each country.
The post A Map of Global Happiness By Country in 2024 appeared first on Visual Capitalist.


